

Conditional Display
Conditional Display is a mechanism for controlling what items appear in a slide based on the user's runtime interactions. The functionality only works with analytic content and includes the ability to show, hide and change content:
- Targeted grids, charts, maps, gauges and report text boxes can all be set to be hidden, shown or changed based on incoming source values.
- Targeted slicers can only be hidden or shown.
Creating Conditional Displays
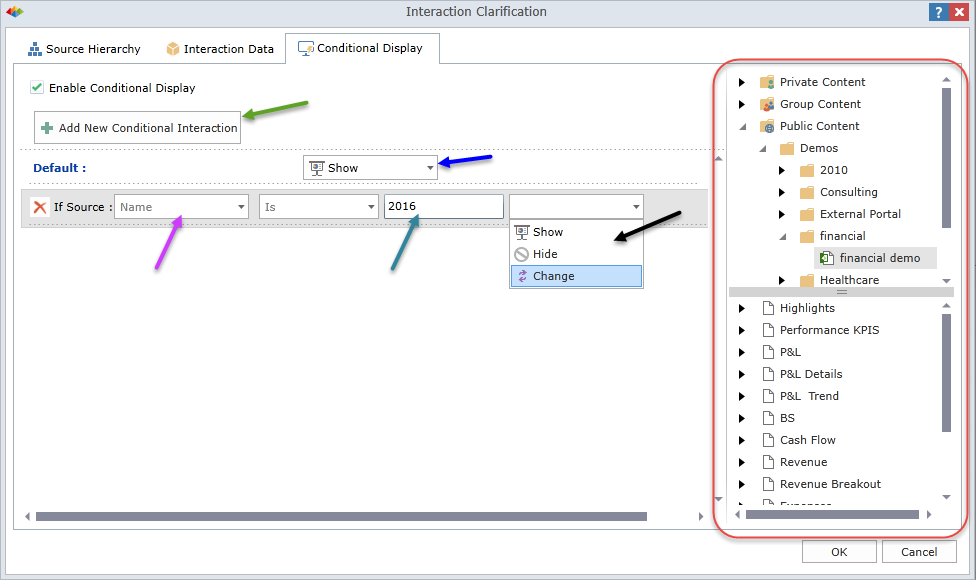
Once an interaction has been drawn into the application, users can edit the interaction to set the conditions for display:
- By default all item is set to "show" (blue arrow). Setting the default to HIDE will keep the original item hidden until a display condition is triggered.
- Clicking the "Add New conditional interaction" button (green arrow) will provide a new conditional logic branch that will allow users to set what logic will apply to the TARGETED ITEM. For each conditional row:
- User set what source value to use for comparison (purple arrow) and then decide on the comparison operator - Is or Is Not (red arrow)
- The value to be used in the comparison is entered in the text box (teal arrow)
- The display action is then set in the drop down (black arrow).
- For all content items except slicers, users can choose to show, hide or change the target.
- If change is selected, the content tree (red highlight) is activated and allows the user to pick an alternative item that will be used to "swap" out the default content target. See change conditional display for more detail below.
- Slicers can only be hidden or shown using conditional display.
Users can add as many conditions as they want to a target to deliver highly interactive and dynamic content in runtime.
NOTE: slicers that are hidden DO NOT interact with data in runtime.
Changing Data Interactions for Changed Content in Conditional Display
Different data interaction options are available for each item that the conditional display target can be changed to (as per above with the black arrow). To see the options for each, swap to the interactions tab (as per below), and choose what type of interaction will be performed for each new item that is exposed during the conditional swap out.
The potential swap out components are shown on the left side of the interaction data tab (blue highlight). The data interaction options for the selected component are shown on the right (red highlight). See data interactions for more detail.
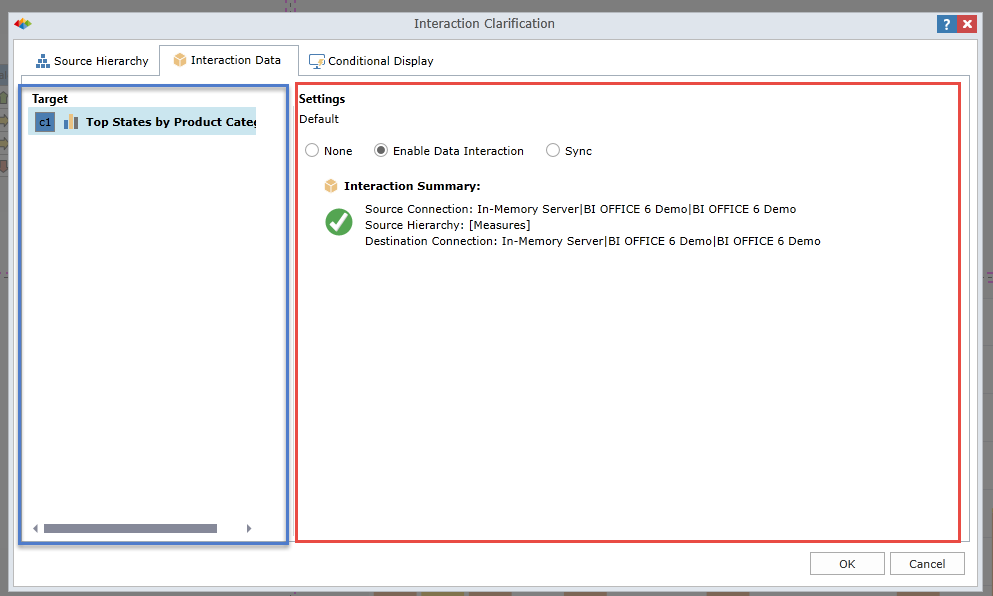
For instance, if the user has a chart 1 in the panel by default, and then choose to change to chart 2 if the year is "2016" (using the conditional display and change logic described above), the blue panel will show 2 choices: chart 1 and chart 2.
- Clicking on chart 1, the user can elect how the incoming data interaction will affect it (none, data interaction, sync) - independent of chart 2
- Clicking on chart 2, the user can elect how the incoming data interaction will affect it (none, data interaction, sync) - independent of chart 1
Home |
Table of Contents |
Index |
User Community
Pyramid Analytics © 2011-2022